
How to Monitor Postman Collections with APImetrics
One of the challenges that developers often face is providing detailed performance stats and alerts to management, stakeholders and even regulators – all while continuing to design, develop and evolve their APIs within Postman, the world’s #1 API platform for developers and testers. Another challenge is understanding how the APIs perform in the wild, around the world, from different cloud data centers.
To address this, APImetrics has partnered with Postman to provide a seamless way for Postman Pro and Postman Enterprise users to synchronize their Postman collections with APImetrics cross-cloud monitoring.
Why Use APImetrics with Postman?
- Get started quickly – zero configuration for Postman users
- Receive detailed metrics, including DNS lookup times, and automatically generated status pages
- Set up alerts via webhook with integrations to MS Teams, Slack, PagerDuty, OpsGenie and more
- Enable automated reporting for banking and other regulatory environments
- Identify where problems might be, including 95th and 99th percentile analysis and automated outlier detection, with machine learning-based reporting and analysis
- Ensure global coverage with our network of 40 locations running in AWS, Azure and Google data centers
Getting Started
Getting started with Postman and APImetrics is simple. If you don’t already have accounts, be sure to sign up with APImetrics and confirm that you have a Postman Pro or Postman Enterprise account.
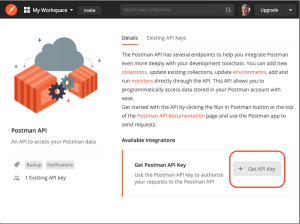
- In Postman, generate or find your API key by following these instructions: https://learning.postman.com/docs/postman/postman-api/intro-api/#authentication.
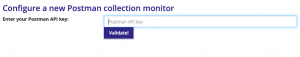
- In APImetrics, select “Monitor Postman Collection” from the side menu.
- At the prompt, enter your Postman API Key.
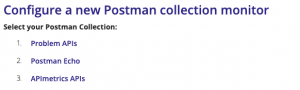
- Continuing in APImetrics, select the Postman Collection you want to monitor.
- Select any optional parameters you want enabled for the collection as it runs.
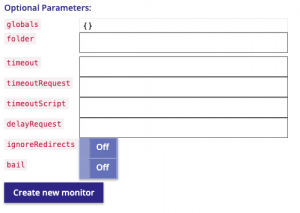
You’re now ready to monitor!
Scheduling API Monitoring
We have 40 locations available for API monitoring with Postman hosted in AWS, Azure and Google data centers. This lets you see how your APIs perform as if they were running on client applications in those locations. Not every cloud is available in every country; here is the full list of locations:
- Australia – AWS, Azure
- Brazil – AWS, Azure
- Belgium – Google
- UAE – AWS
- Canada – Azure
- Germany – AWS
- Hong Kong – AWS, Azure, Google
- Ireland – AWS, Azure
- India – AWS, Azure
- Japan – Azure, AWS, Google
- Korea – Azure
- Netherlands – Azure
- South Africa – Azure
- United Kingdom – Azure, Google
- United States – Azure, AWS, Google
Schedules can be set to call an API as frequently as once per minute. The scheduler automatically handles distributing the calls evenly between locations. You can select an individual location, agent or region.
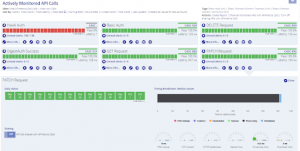
Once monitoring for your Postman Collection has been scheduled and the results are received, your APImetrics homepage will be populated with API calls.
Network Timings
To take advantage of detailed reporting on network timings, add the following to your API headers in your collections:
>Connection: close
Your APImetrics results will then include DNS lookup times, TCP connect times, and SSL handshake values.
Reviewing the Results
In the home page view on APImetrics, you’ll be able to see the last 24 hours / 14 days of availability, the pass rate, and median latency. After a week, you’ll also get the see the CASC score (Cloud API Service Consistency), which is a general indication of API health.
Beyond the home page there are analysis and reporting tools to give you detailed insights into how cloud and networking issues impact users and developers, plus sharing options for more detailed reports, as well as pre-set reports designed for industry regulators.
Alerting, SLOs and SLAs
APImetrics provides a range of additional options for tracking your critical SLAs, helping define Service Level Objectives and integrations to provide alerting through all the common tools and services people use like PagerDuty, VictorOps, OpsGenie, Slack and more.
Sign Up for a Free APImetrics Account
Sign up for a free APImetrics account and use the discount code Postman2019. You’ll get 10% off your first year of any type of account!
What do you think about this topic? Tell us in a comment below.