Introducing Postman Visualizer: Easily Turn API Data into Charts and Graphs
In addition to being a developer advocate, I am also a regular consumer of APIs. I usually find it difficult to make sense of the data they return. APIs are supposed to be machine-readable interfaces, true. Yet, I have often called an API in Postman, and then copied the response into a data visualization tool to understand the data better.
What if I told you Postman now has a way to program and render data visualizations right within the context of your request?
Say “hello” to Postman Visualizer. It is your canvas to paint an endpoint’s response the way you want; beyond the confines of Pretty, Raw, and Preview response views.
More value to your API data
You will now see the new Visualize tab in the response body area in Postman. The content of this tab is generated programmatically using scripts in the request. You can use the new pm.visualizer.set() method to build the view. More on this soon, but first, let’s see why visualizers may be useful for you.
If any request in the collections that you import into your Postman app have a visualizer script in them, you will see the result in the Visualize tab after you send the request.
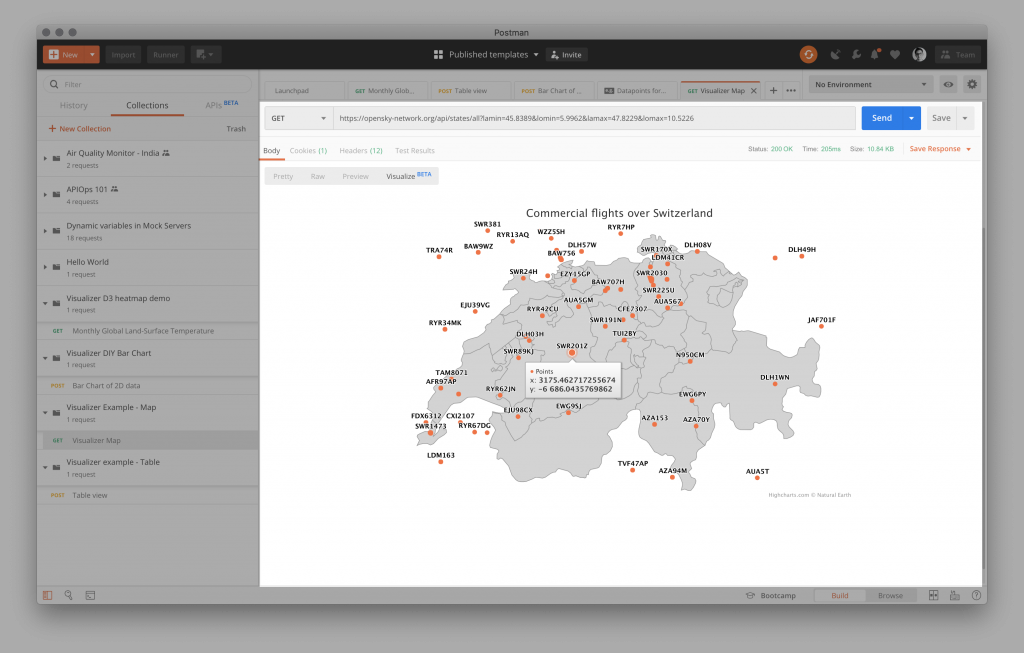
If you use APIs like me as part of your daily job, you will soon fall in love with the fact that you can now make sense of API data without leaving Postman. Click the button below to load a heatmap visualization example.
Leverage your existing toolkit
Visualizers are the easiest way for developers to create and share representations of API data with others. You can bring your existing HTML visualization toolkit into Postman. Visualization scripts are saved in requests that you can add to collections. Once you share or publish a collection, those who import it will see the same visualization rendered under the Visualize tab for the response.
What’s more, they can build upon your work. All they need to do to extend your visualization is to edit the code that you pass as the HTML string to the pm.visualizer.set() method.
There are three main steps to using visualizers:
- Build a request in Postman, along with the credentials to get a successful response.
- Write your data visualization code like a standalone HTML page. You can include any JavaScript library or CSS of your choice from a hosted CDN URL. Pass this code as a
stringto the first argument ofpm.visualizer.set()method. - Bind response data to the HTML template by passing it as the second argument to the
pm.visualizer.set()method.
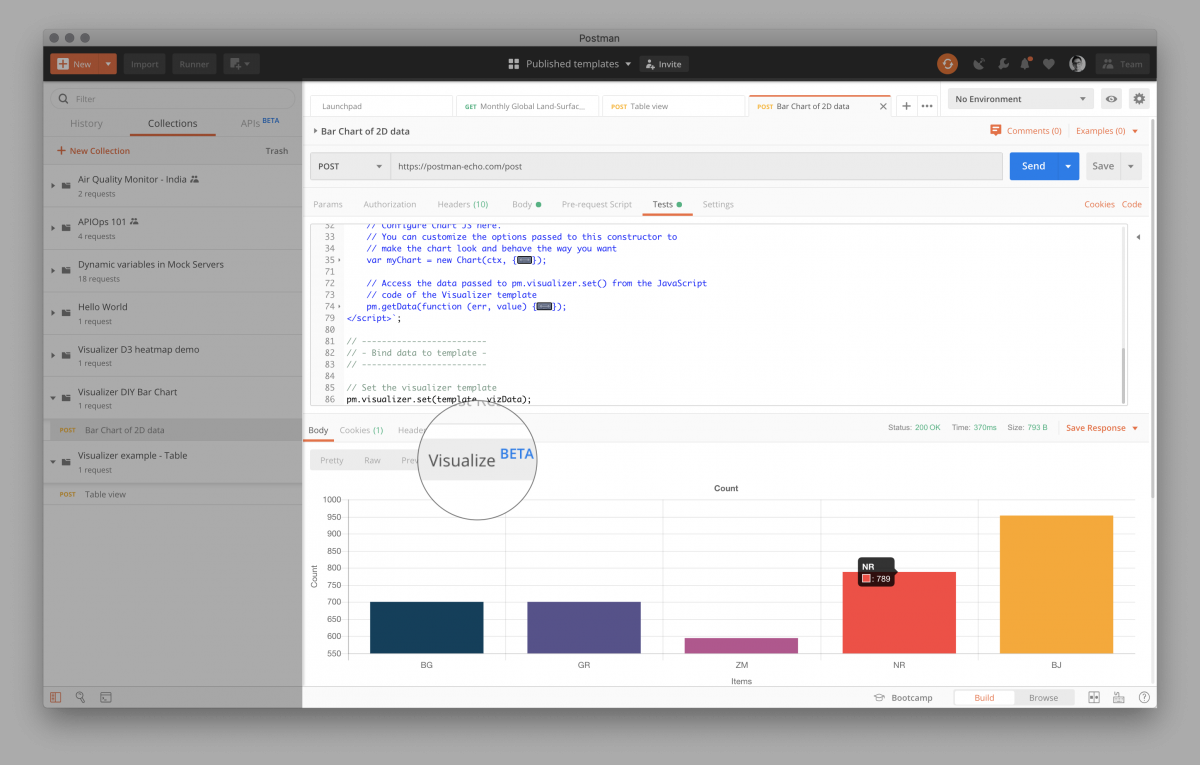
Try it out for yourself in the Postman app. Click the button below to import a collection that will show you how to draw a simple bar chart using ChartJS in Postman.
Share with the world
You can build a tabular view of your data, print a single value, or you can go as crazy (or as sane) as you want with your creativity. If you build something interesting, you can share that with the Postman community by publishing your collection as a Template in Postman. Read the docs.
Finally, we encourage you to watch this info-packed three-minute Postman Visualizer demo.
What do you think about this topic? Tell us in a comment below.